
| 일 | 월 | 화 | 수 | 목 | 금 | 토 |
|---|---|---|---|---|---|---|
| 1 | 2 | 3 | 4 | 5 | 6 | 7 |
| 8 | 9 | 10 | 11 | 12 | 13 | 14 |
| 15 | 16 | 17 | 18 | 19 | 20 | 21 |
| 22 | 23 | 24 | 25 | 26 | 27 | 28 |
| 29 | 30 |
- 파이썬
- 귀여운고래
- pyvista
- docker
- 지하철역좌표
- 데이터입수
- Python
- 동명이인찾기
- 3d
- 알고리즘
- 폴더조사
- osmnx
- 좌표거리
- GNN
- STL
- 도커 레이어
- 그리드분할
- GIS
- GCN
- 패치분할
- python최단거리
- 3d데이터
- graph
- geopandas
- 컨테이너
- Set
- MESH
- 도커
- 이미지빌드
- geojson
- Today
- Total
이것저것 기록
[python] NetworkX를 사용해서 데이터분석 및 시각화 해보기 본문

NetworkX는 파이썬 기반의 모듈로, 다양한 그래포 알고리즘을 제공한다.
우연히 알게된 라이브러리인데 생각보다 적용할 수 있는 영역이 다양하고, 무엇보다 그래프라는 툴을 사용하면 데이터 간의 상관관계나 연결성 등 분석할 수 있는 카테고리가 상당히 많아진다.
처음엔 데이터에 그래프라는 개념을 접목시킨다는 점이 다소 생소해서 해당 라이브러리에 익숙해지기까지 꽤나 시간이 걸렸지만...
일단 익숙해지고 나니까 그래프의 파워(?)를 느끼고 매우 신기했었다 ㅋㅋ
어쨌든~~ 오늘 사용할 데이터는 바로 이 데이터다.
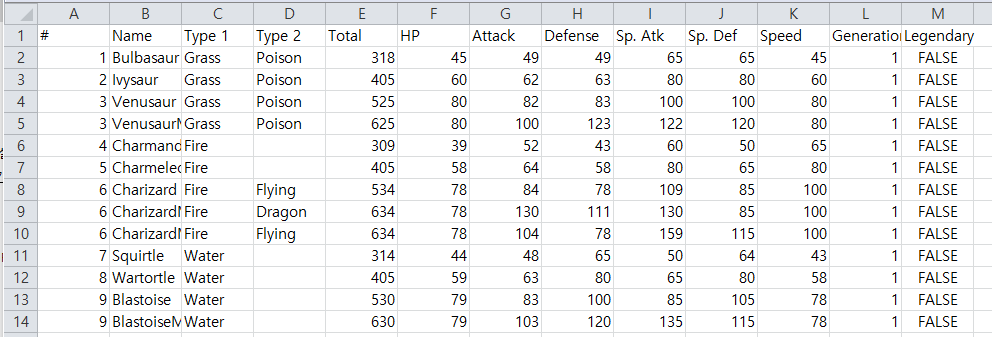
어디서 얻었는지 기억이 안나는 포켓몬 데이터다.
총 12개의 열이 있고, 행은 포켓몬 종류를 나타낸다. 총 800종이 있다.
포켓몬 종류가 이렇게 많은지 처음 알았음...;;
1. 필요한 라이브러리 불러오기
import numpy as np
import pandas as pd
import seaborn as sns
import matplotlib.pyplot as plt
import networkx as nx
일단 필요한 라이브러리부터 불러오기~~
networkx는 nx로 줄여쓰는 것이 일반적이다. numpy를 np로 줄여쓰는 것과 똑같음.
2. 데이터 불러오기
data = pd.read_csv('C:/Users/user/Desktop/PyStudy/Pokemon.csv')
data.head() #상위 다섯개
data.tail() #하위 다섯개
print(len(data.isnull().any())) #null값이 있는지 확인
data.isnull().any()
data['Type 2'].replace(np.nan, '0', inplace = True) #null값 채워주기
data['Type 2'].head(10) #'Type 2'컬럼의 상위 열개 출력
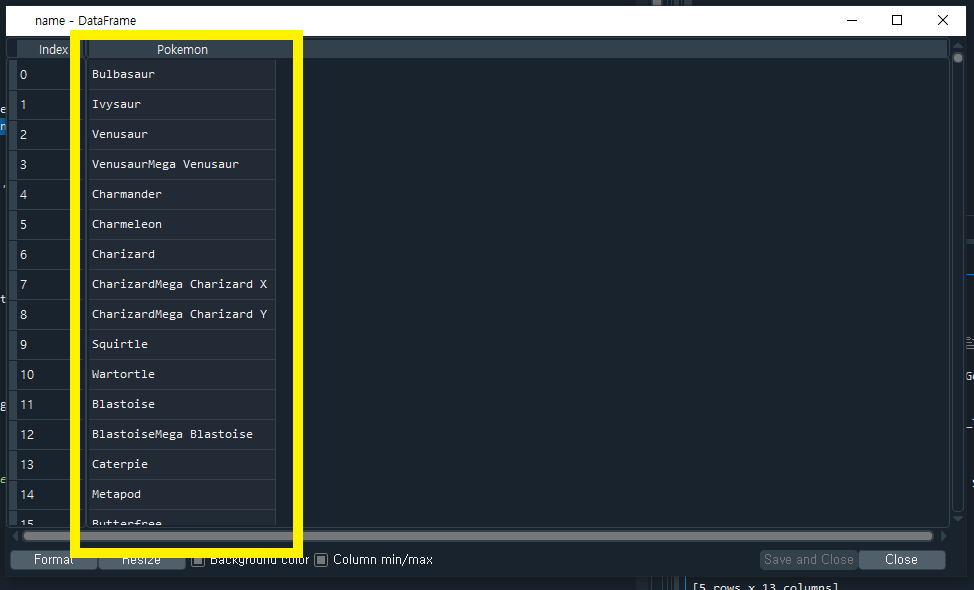
print("Number of pokemon are: " + str(data['Name'].nunique())) #포켓몬 종류
name = pd.DataFrame(data['Name'].unique().tolist(), columns = ['Pokemon']) #포켓몬 종류 DataFrame
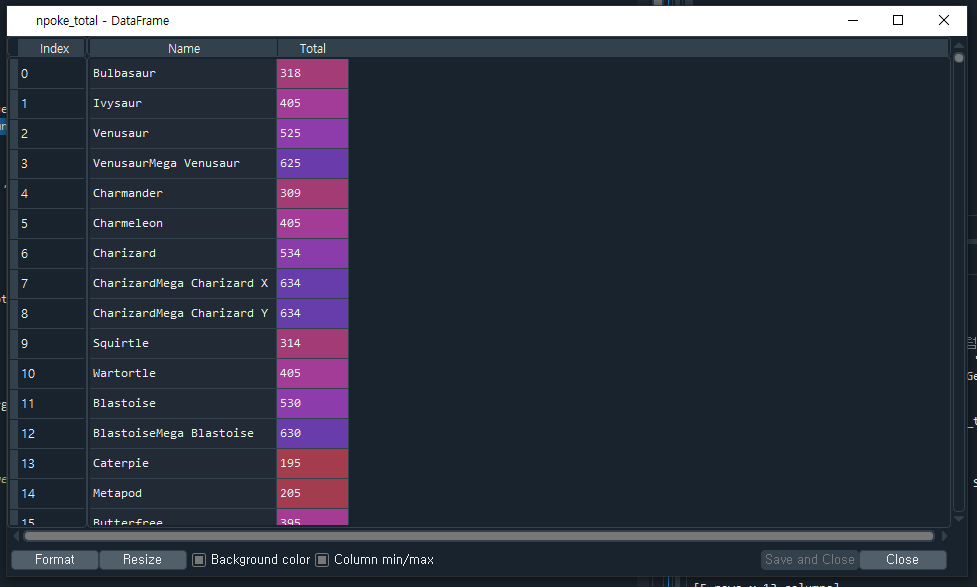
npoke_total = data.copy()
print(npoke_total.columns) #컬럼명확인
npoke_total = pd.concat([npoke_total['Name'], data['Total']], axis=1) #포켓몬 종류와 각각의 종류 별로 몇마리인지pd.read_csv를 사용하면 엑셀 시트를 불러올 수 있다. data라는 변수에 할당.
data.head()와 data.tail()은 상위/하위 다섯개 (조정 가능)의 데이터를 확인해주는 코드인데, 엑셀 시트안에 데이터가 어떻게 들어가 있는지 대충 확인할 때 사용하기 좋다.
엑셀 데이터로 분석을 시작하기 전엔 항상 null값이 있는지 확인을 해줘야한다.
print(len(data.isnull().any())로 null값의 갯수를 확인하고, null값이 들어가있는 컬럼을 찾아서 0으로 일괄 입력 해주었다.
print("Number of pokemon are: " + str(data['Name'].nunique())) 로 포켓몬 종류가 총 몇 개인지 확인해줬다.

그리고 포켓몬의 종류 이름들을 'name'이라는 리스트에 저장해줬다. 컬럼명은 'Pokemon'.
npoke_total에는 포켓몬의 종류 이름과 각각의 종류가 몇 마리씩 있는지 (엑셀 시트의 'Total'컬럼) 정보를 넣어주었다.
3. 분석 및 시각화
3.1 포켓몬 종류 별 몇 마리?
포켓몬 종류 별 개체수 상위 30에 대한 시각화 결과이다.
sns.set()
plt.figure(figsize=(8,20))
ax = sns.barplot(x = 'Total', y = 'Name', data = npoke_total.sort_values(by = 'Total', ascending = False).head(30))
ax.set(xlabel = 'Overall', ylabel = 'Pokemon')
plt.show()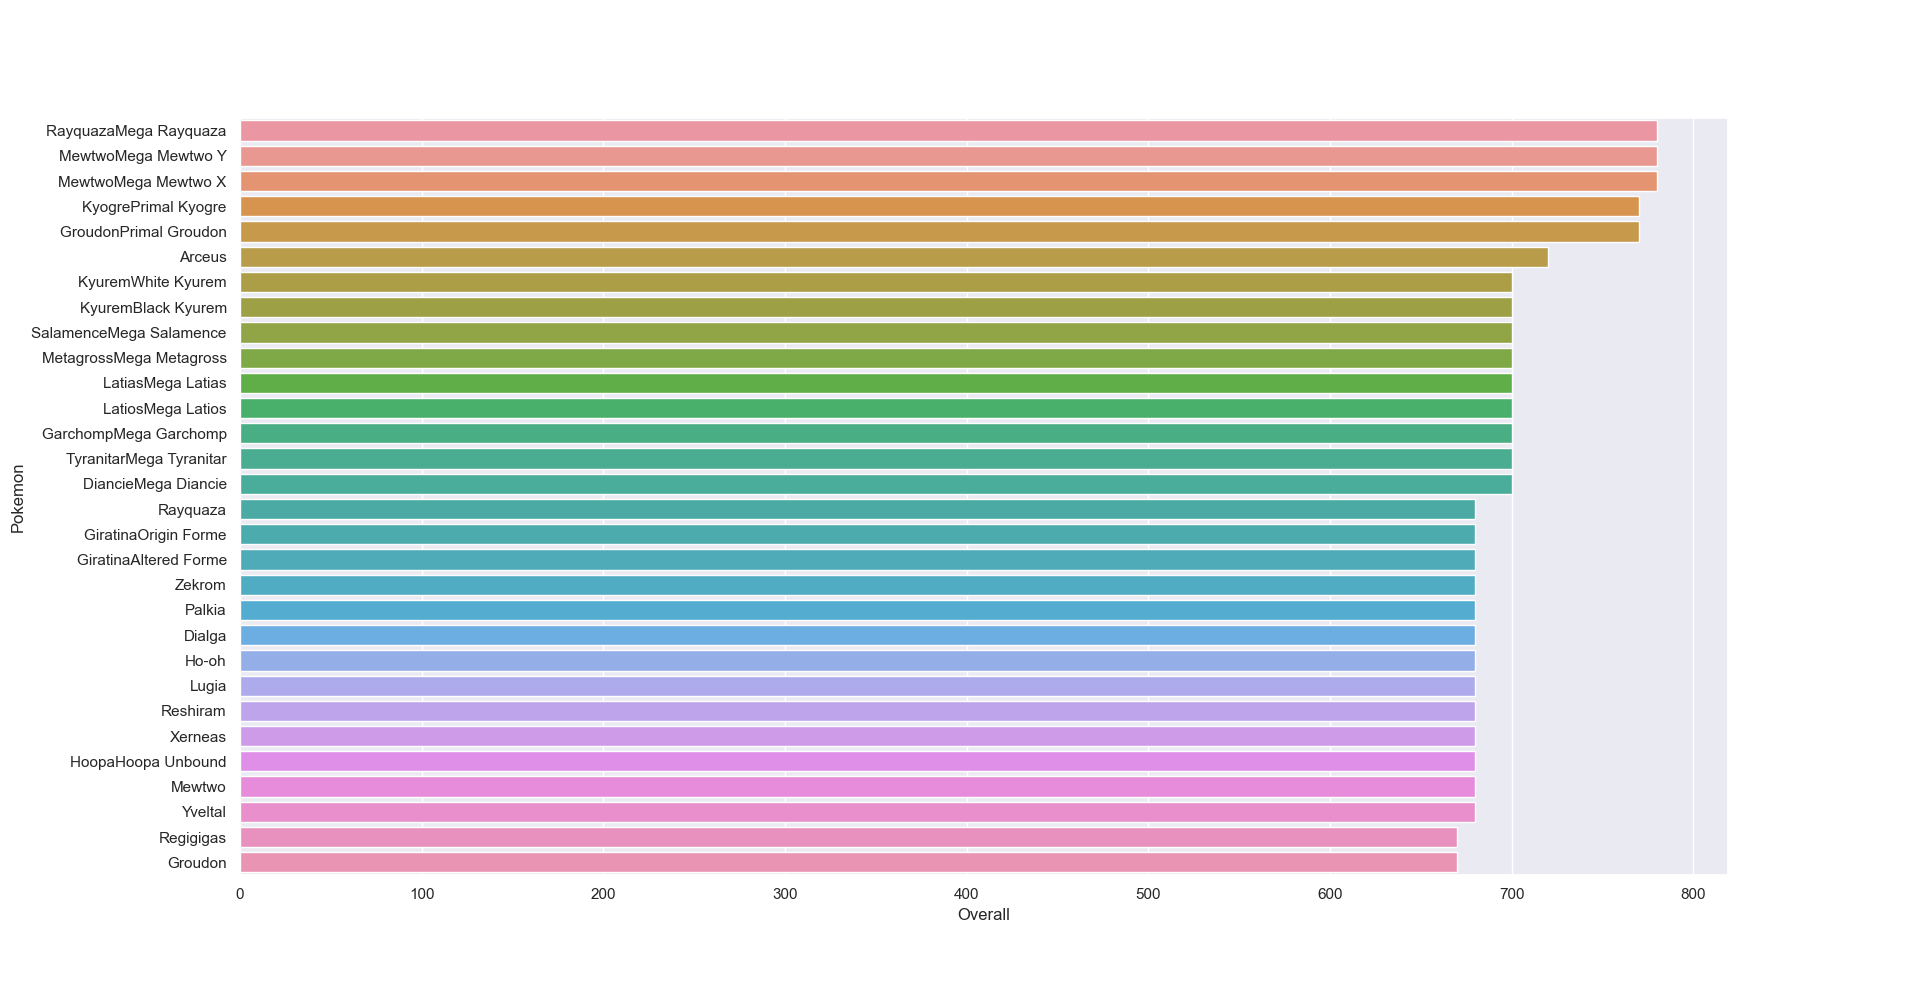
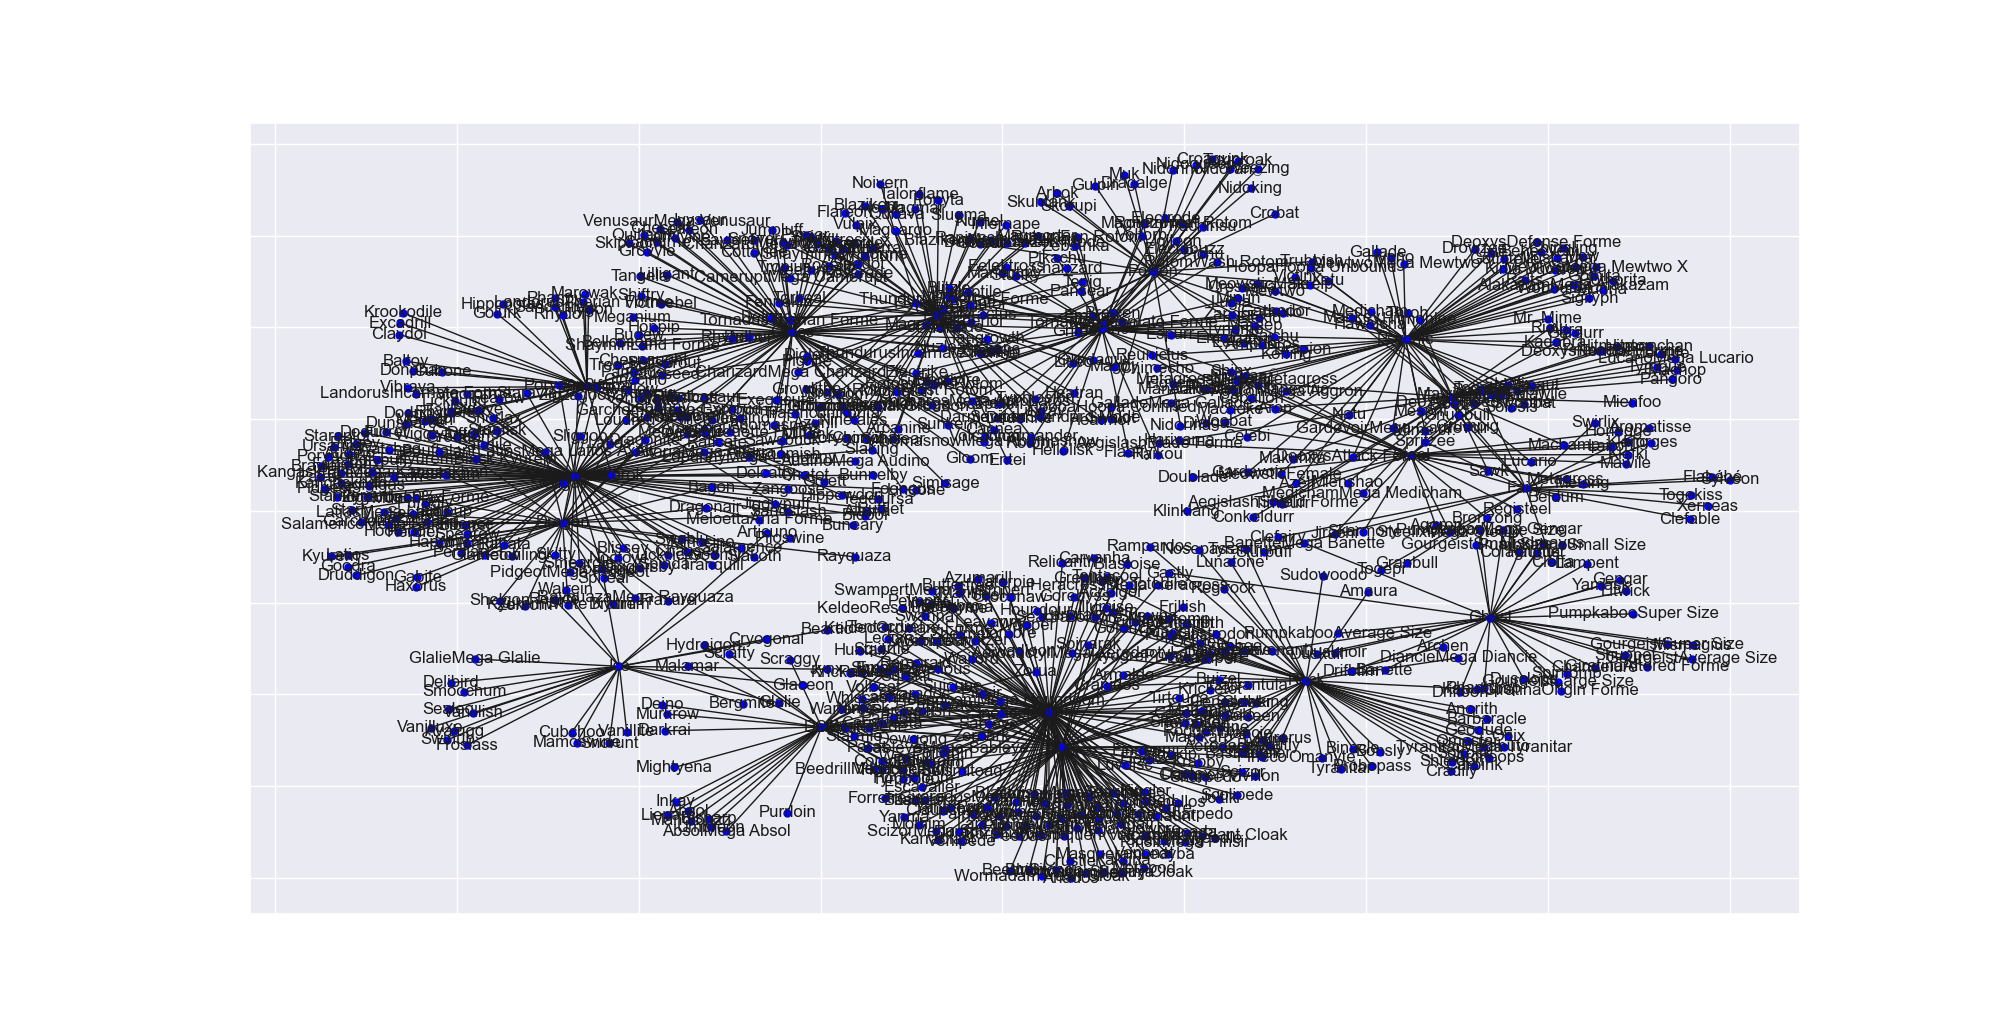
3.2 종류 별 연관 그래프
데이터의 Type1 컬럼을 보면 다른 종류임에도 동일한 Type1 정보를 가지고 있는 케이스가 잇다.
포켓몬을 본지가 너무 오래돼서... Type1이 정확히 뭘 의미하는지는 모르겠지만 (아마도 속성일 것이라 추정)
포켓몬 종류별로 Type1에 대한 연관성 그래프를 시각화 했다. (드디어 NetworkX 라이브러리 사용!)
#Network analysis
g = nx.Graph()
g = nx.nx.from_pandas_edgelist(data, source = 'Name', target = 'Type 1')
print(nx.info(g))

plt.figure(figsize=(20, 20))
pos = nx.spring_layout(g, k = 0.15)
nx.draw_networkx(g,pos, node_size = 25, node_color = 'blue')
plt.show()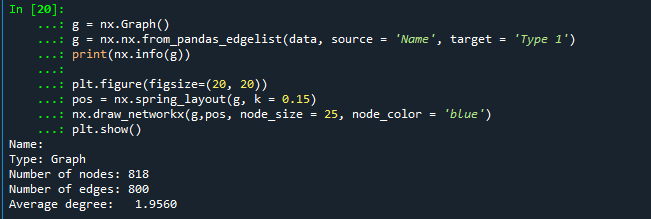
3.3 Type1 별 비율
시각화 결과, 물속성의 포켓몬의 개체수가 가장 많고, 요정속성?의 포켓몬 개체수가 가장 적은 것을 확인할 수 있었다.
파이팅 속성은 도대체 뭐지... 공격형 포켓몬이라는 건가?
gen1 = data[data.Generation == 1]
types = gen1['Type 1']
explode = np.arange(len(types.unique())) * 0.01

colors = [
    'red',
    'blue',
    'yellow',
    'green'
]
types.value_counts().plot.pie(
    explode=explode,
    colors=colors,
    title="Percentage of Different Types of Pokemon",
    autopct='%1.1f%%',
    shadow=True,
    startangle=90,
    figsize=(9,9)
)
plt.tight_layout()
plt.show()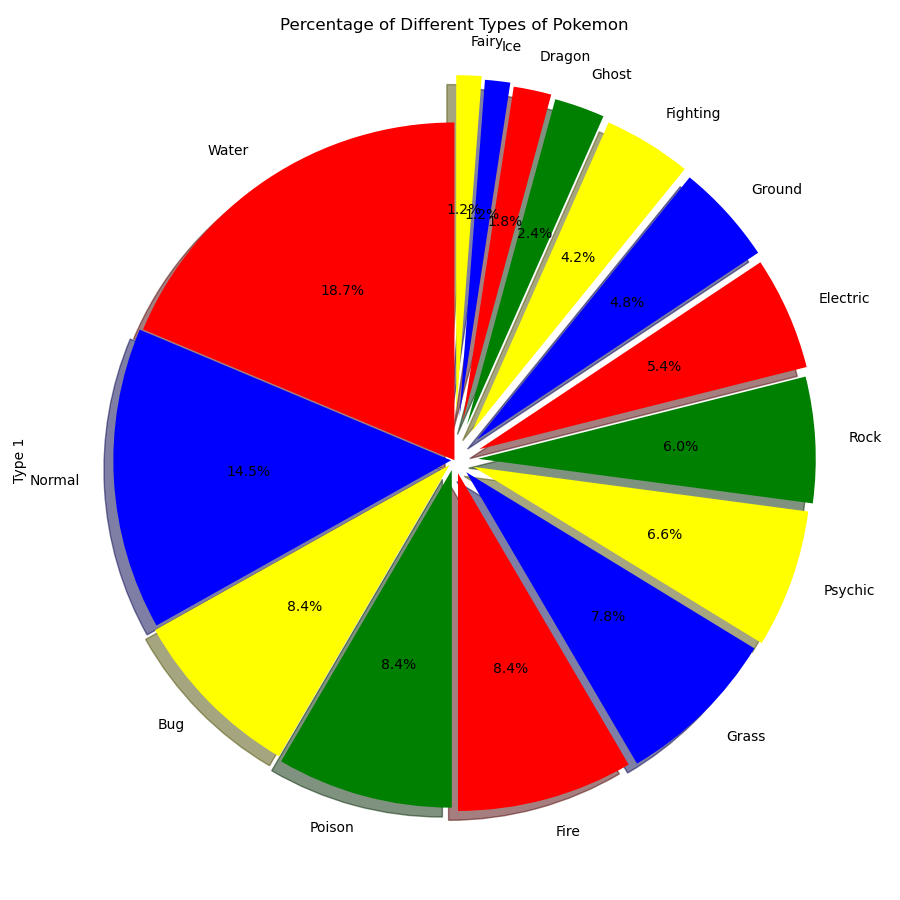
3.4 전설의 포켓몬 vs. 비전설의 포켓몬
types = gen1['Legendary']
explode = np.arange(len(types.unique())) * 0.01

colors = [
    'yellow',
    'green'
]
types.value_counts().plot.pie(
    explode=explode,
    colors=colors,
    title="Percentage of Legendary to NoN-Legendary",
    autopct='%1.1f%%',
    shadow=True,
    startangle=90,
    figsize=(6,6)
)
plt.tight_layout()
plt.show()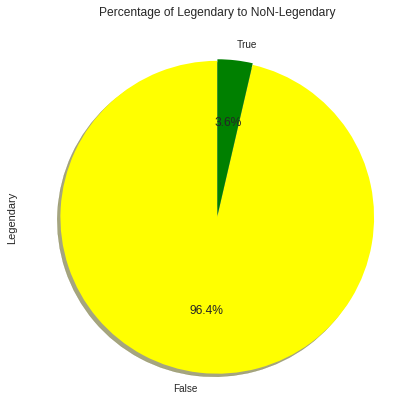
3.5 1세대 포켓몬 대상으로 Type1 연결성 분석
g = nx.from_pandas_dataframe(gen1,source='Name',target='Type 1')
print(nx.info(g))
nx.Graph()
plt.figure(figsize=(20, 20))
pos=nx.spring_layout(g, k=0.0319)
nx.draw_networkx(g,pos,node_size=805, node_color='pink', font_size=15)
plt.show()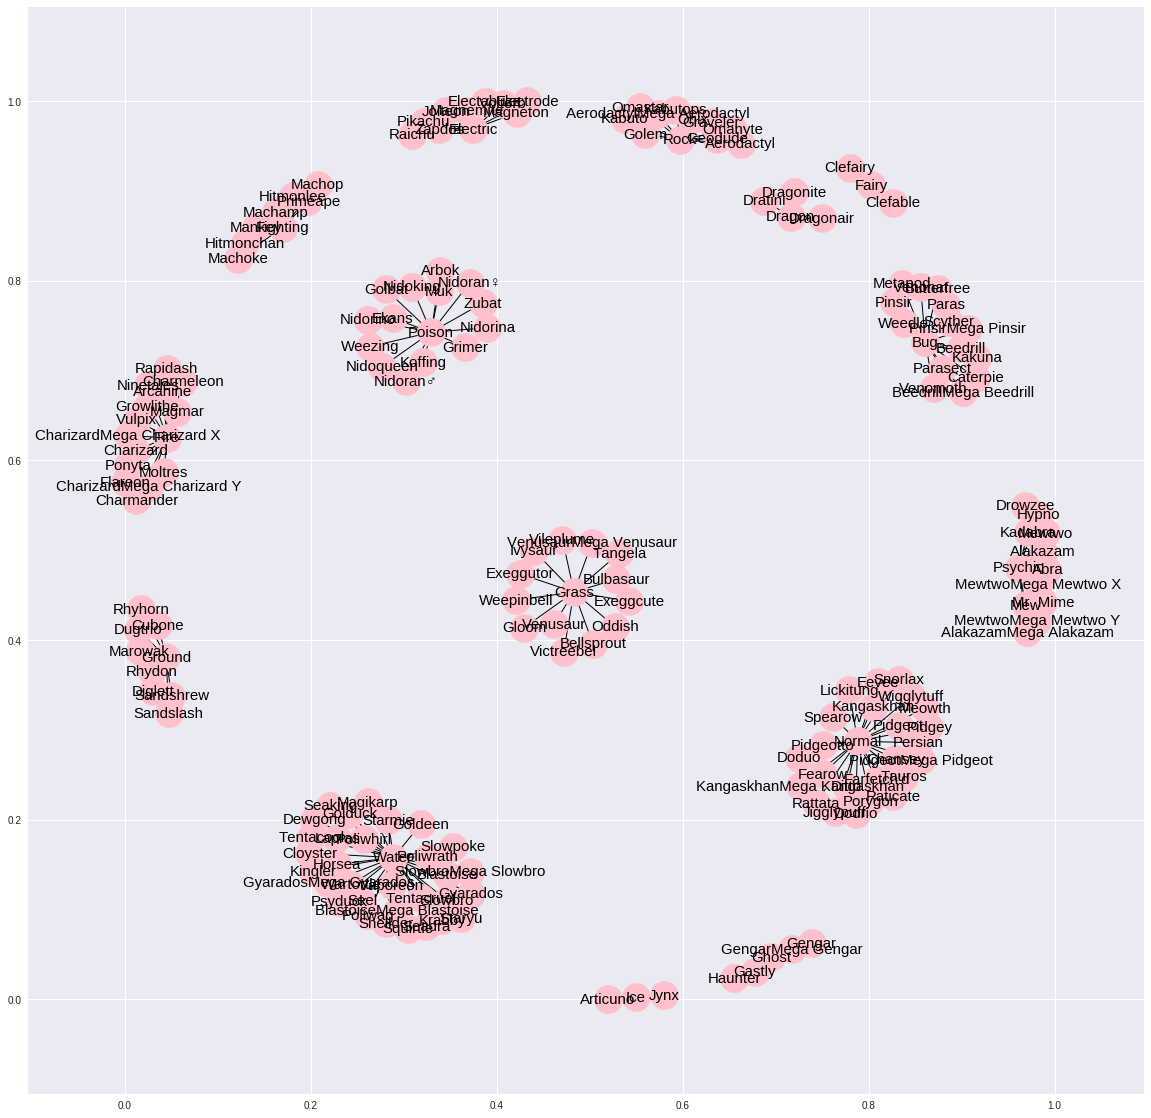
'코린이 > 실무를 위한 코딩 기록' 카테고리의 다른 글
| [python, GIS] OSMnx을 이용한 성남시 도로망 분석 및 시각화 (2) | 2020.11.03 |
|---|---|
| [python] NetworkX를 이용한 왕좌의 게임 등장인물 네트워크 분석 (0) | 2020.11.02 |
| [python, folium] 서울 따릉이 대여소 (x,y)좌표 변환 및 지도 시각화 (1) | 2020.10.09 |
| [python] 파이썬에서 shape파일을 불러오는 여러 방법들 및 활용 (0) | 2020.09.24 |
| [python, openCV] 이미지 파일에서 특정 픽셀값만 추출하기 (0) | 2020.09.21 |


