
Notice
Recent Posts
Recent Comments
Link
| 일 | 월 | 화 | 수 | 목 | 금 | 토 |
|---|---|---|---|---|---|---|
| 1 | 2 | 3 | 4 | 5 | 6 | 7 |
| 8 | 9 | 10 | 11 | 12 | 13 | 14 |
| 15 | 16 | 17 | 18 | 19 | 20 | 21 |
| 22 | 23 | 24 | 25 | 26 | 27 | 28 |
| 29 | 30 |
Tags
- 패치분할
- 컨테이너
- docker
- 3d
- GIS
- 도커 레이어
- 귀여운고래
- MESH
- graph
- 좌표거리
- GCN
- osmnx
- geopandas
- 이미지빌드
- GNN
- 폴더조사
- 알고리즘
- 파이썬
- 그리드분할
- pyvista
- geojson
- 동명이인찾기
- 지하철역좌표
- python최단거리
- Python
- 도커
- 3d데이터
- 데이터입수
- STL
- Set
Archives
- Today
- Total
이것저것 기록
[python, GIS] OSMnx로 OSM 지도를 그래프로 불러오는 방법 본문
OSMnx 라이브러리를 사용하면 OSM 지도 위의 어떤 도로든 노드-엣지 그래프로 불러올 수 있다.
찾아보니 여러가지 방법이 있는 것 같아서, 오늘은 그 방법들을 포스팅해볼까 한다.
1. 위도 경도 정보를 사용해서 불러오기 (osmnx.graph.graph_from_point)
'''
Method1-1: passing a lat-lng point and network distance in meters
'''
location_point = (37.791427, -122.410018)
G1_1 = ox.graph_from_point(location_point, dist=500, dist_type='network')
fig, ax = ox.plot_graph(G1_1, node_color='r')


'''
Method1-2: passing a lat-lng point bbox distance in meters
'''
# define a point at the corner of California St and Mason St in SF
location_point = (37.791427, -122.410018)
G1_2 = ox.graph_from_point(location_point, dist=750, dist_type='bbox', network_type='drive')
fig, ax = ox.plot_graph(G1_2, node_color='r')
1번 방법은 dist_type의 인자를 bbox를 줄것이냐 network를 줄것이냐에 따라 1-1과 1-2로 나눌 수 있다.
dist_type은 두 가지 종류가 있다.
-
dist_type (string): {‘network’, ‘bbox’} if ‘bbox’, retain only those nodes within a bounding box of the distance parameter. if ‘network’, retain only those nodes within some network distance from the center-most node.
불러올 네트워크도 도로, 인도, 자전거 도로 등 인자값을 바꾸어 선택할 수 있다.
-
network_type (string): what type of street network to get if custom_filter is None. One of ‘walk’, ‘bike’, ‘drive’, ‘drive_service’, ‘all’, or ‘all_private’.


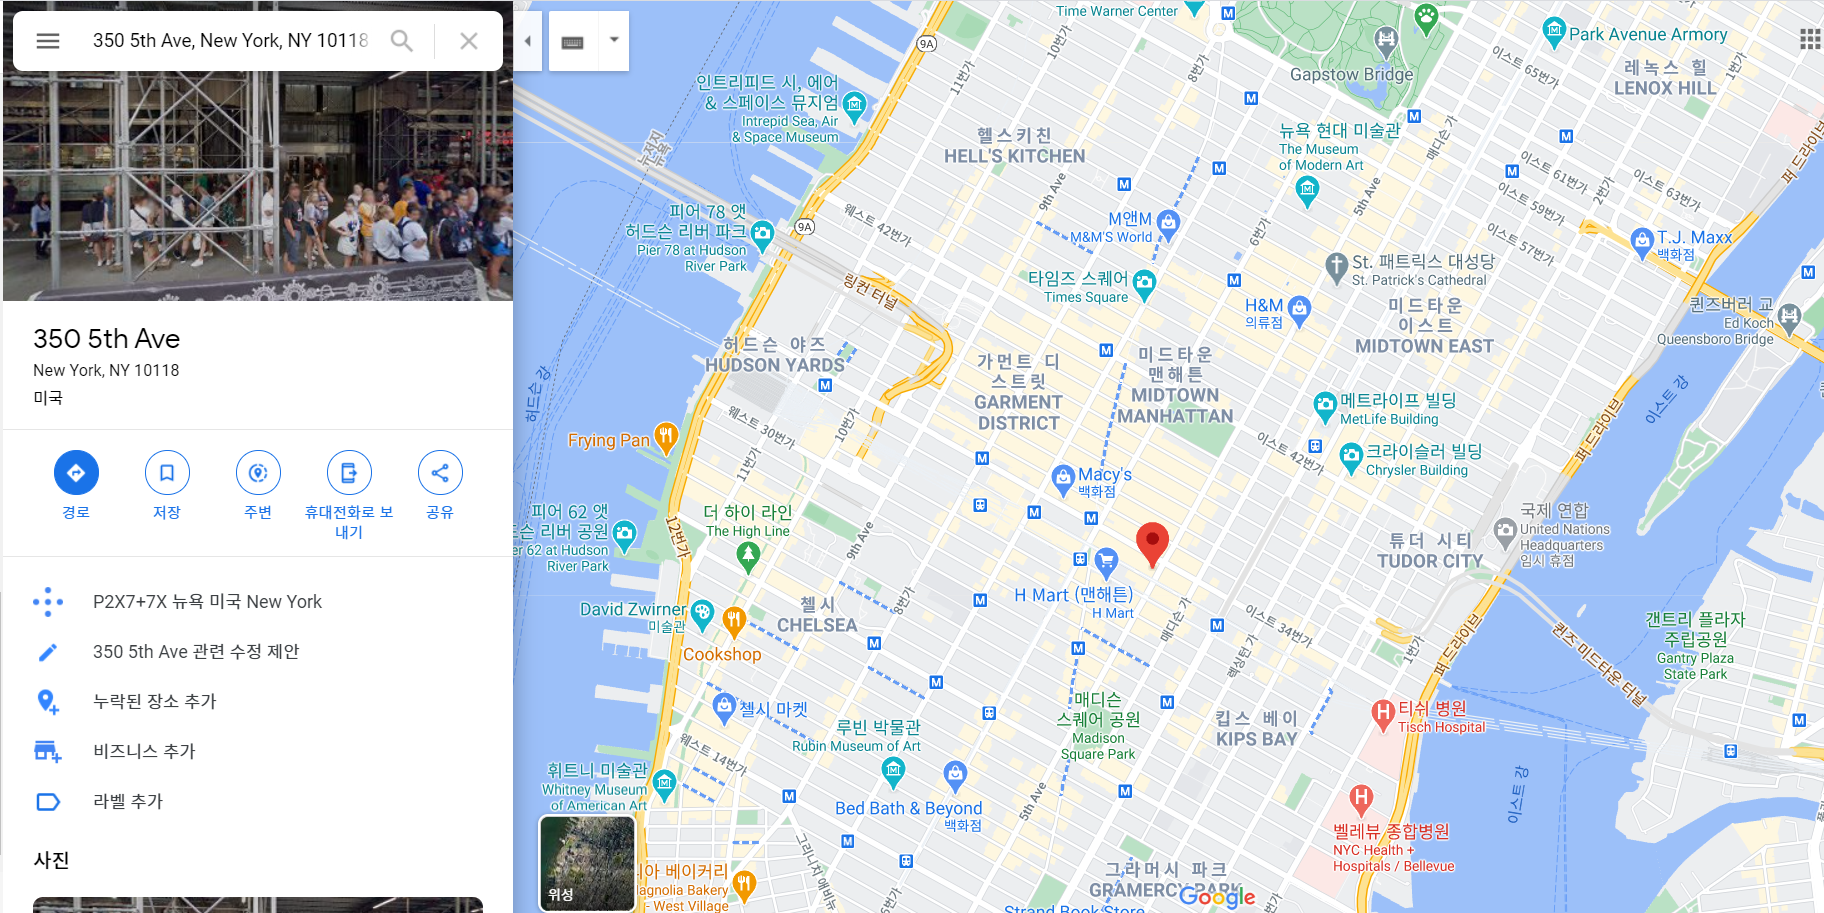
2. 주소 정보를 사용해서 불러오기 (osmnx.graph.graph_from_address)
'''
Method2: passing an address and distance (bbox or network) in meters
'''
# network from address, including only nodes within 1km along the network from the address
G2 = ox.graph_from_address(address='350 5th Ave, New York, NY', dist=1000,
                          dist_type='bbox', network_type='drive')
fig, ax = ox.plot_graph(G2, node_color='r')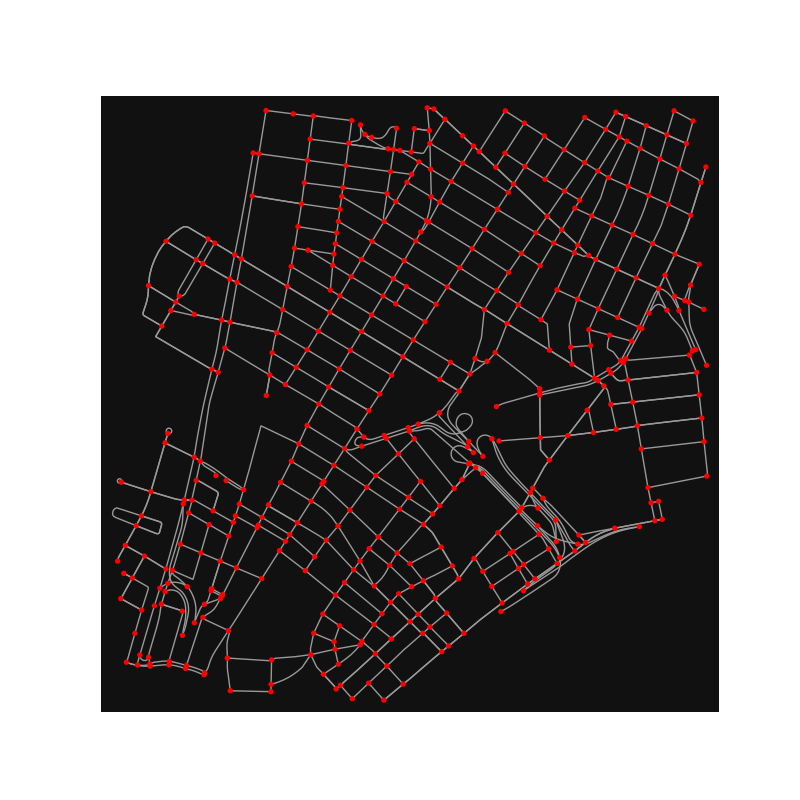
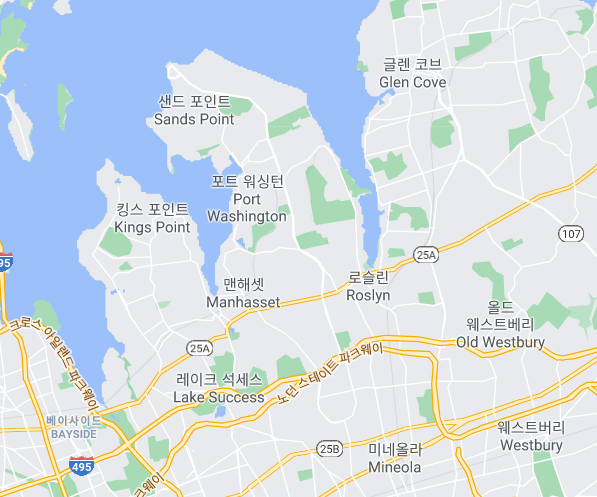
3. 지역명을 사용해서 불러오기 (osmnx.graph.graph_from_place)
'''
Method3: passing a place name
'''
G3 = ox.graph_from_place('North Hempstead, New York, USA', network_type='drive')
fig, ax = ox.plot_graph(G3, node_color='r')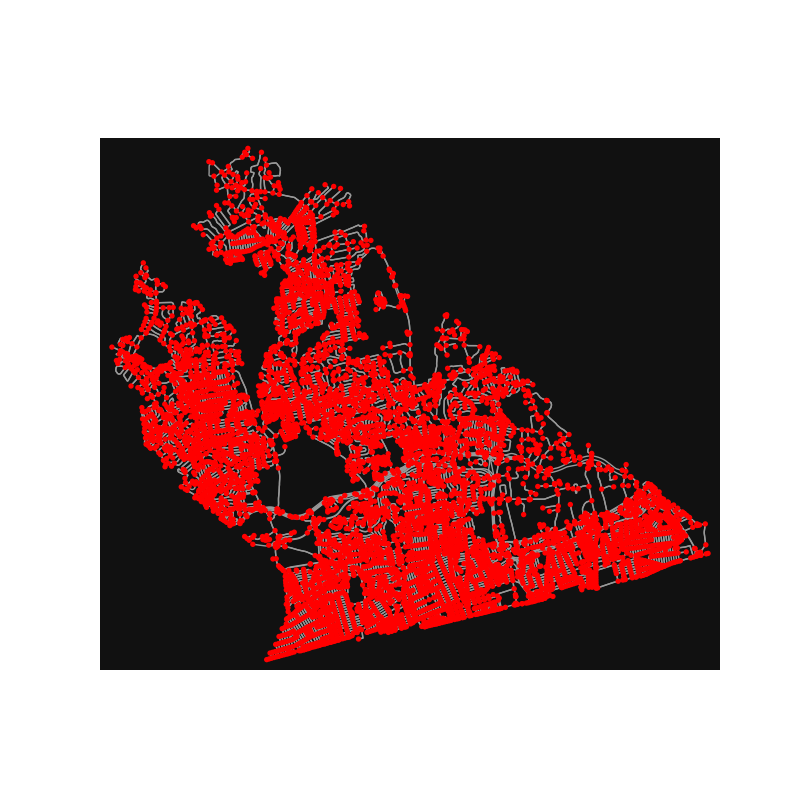
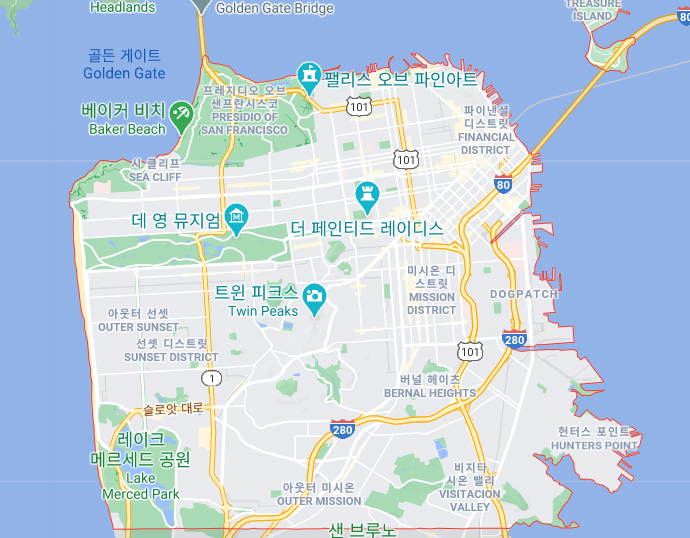
4. 동서남북 좌표를 사용해서 불러오기 (osmnx.graph.graph_from_bbox)
'''
Method4: passing a bbox
'''
# define a bounding box in San Francisco
north, south, east, west = 37.79, 37.78, -122.41, -122.43

# create network from that bounding box
G4 = ox.graph_from_bbox(north, south, east, west, network_type='drive_service')
fig, ax = ox.plot_graph(G4, node_color='b')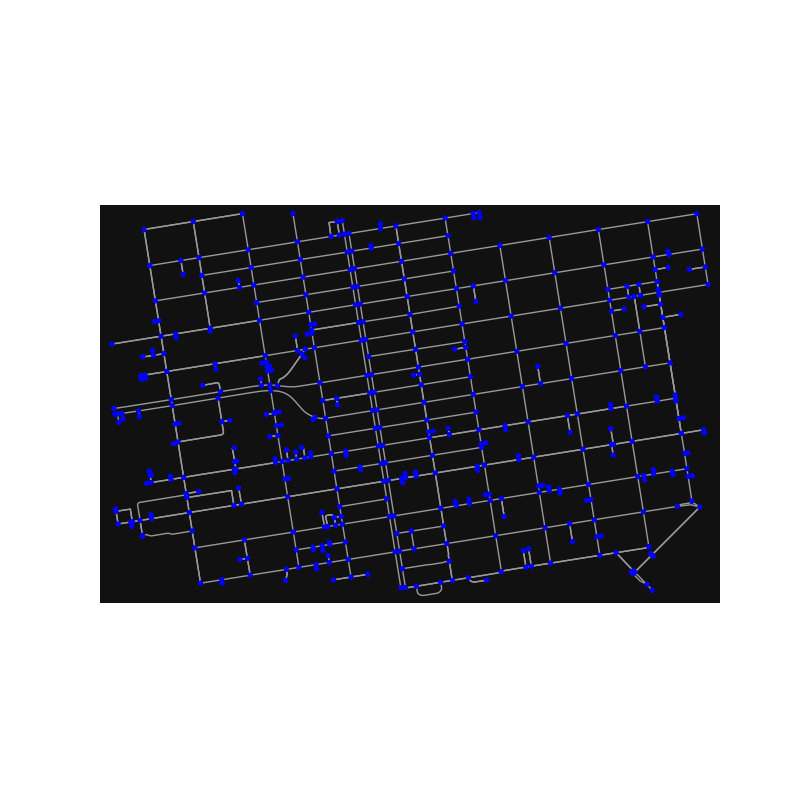
'코린이 > 실무를 위한 코딩 기록' 카테고리의 다른 글
| [python, GIS] OSMnx로 지역명을 geodataframe으로 불러오기 (0) | 2020.11.06 |
|---|---|
| [python, GIS] OSMnx를 이용한 최단경로탐색 및 계산 (0) | 2020.11.04 |
| [python, GIS] OSMnx을 이용한 성남시 도로망 분석 및 시각화 (2) | 2020.11.03 |
| [python] NetworkX를 이용한 왕좌의 게임 등장인물 네트워크 분석 (0) | 2020.11.02 |
| [python] NetworkX를 사용해서 데이터분석 및 시각화 해보기 (4) | 2020.11.02 |
'코린이/실무를 위한 코딩 기록' Related Articles
more


Comments